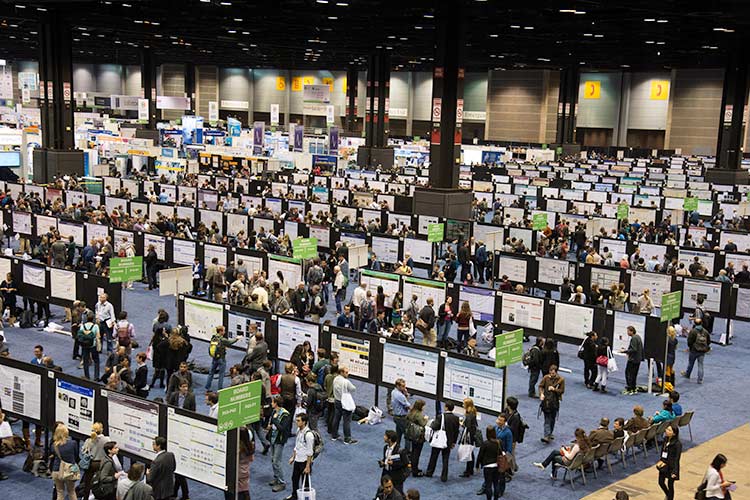
The Society for Neuroscience (SfN), one of the biggest neuroscience conference in the world, is approaching in a few weeks. It has over 14,700 posters presented across 5 days this year. For people who went to SfN, you know that it is an exhaustive conference. Basically, it is hard to plan out as a newcomer to the conference (like myself as a grad student). One way to plan out what to see in the conference is to use a search and recommendation engine provided by SfN (that we’ve helped SfN build since 2015!) that you can use for searching for specific posters. However, if you are someone who likes to hover around the conference and see what interesting posters you happen to come across, my analysis below will hopefully help you plan out where to go while the conference based on the themes of research that you’re generally interested in. This analysis can provide you with a global overview of the research being presented at SfN this year. My analysis is divided into main 3 sections (1) Getting a basic summarization of themes in SfN, (2) Finding the number of unique authors presenting at SfN, and (3) Using language modeling to analyze which of the topics in neuroscience have similar language usage.
Distribution of themes in SfN
When author submits to SfN, they have to choose a theme, topic and subtopic they are working on.
For example, poster can have subtopic of D.03.i. Pain models: Behavior which is in the D.03. Somatosensation: Pain topic and Theme D: Sensory Systems theme. These themes change over years. For this year, there are 10 themes, 83 topics and 510 subtopics that authors can choose when submitting the poster. Authors are allowed to choose multiple subtopics for submission. For example, one poster can have 2 subtopics such as D.07. Vision and H.02. Human Cognition and Behavior. For this year, 60 percent of the posters have 1 topic with and the remaining 40 percent have 2 topics. This is very similar to last year where there are 60.4 percent of posters had 1 topic. If we divide posters using the first submitted theme (theme1), we can see the distribution as follows
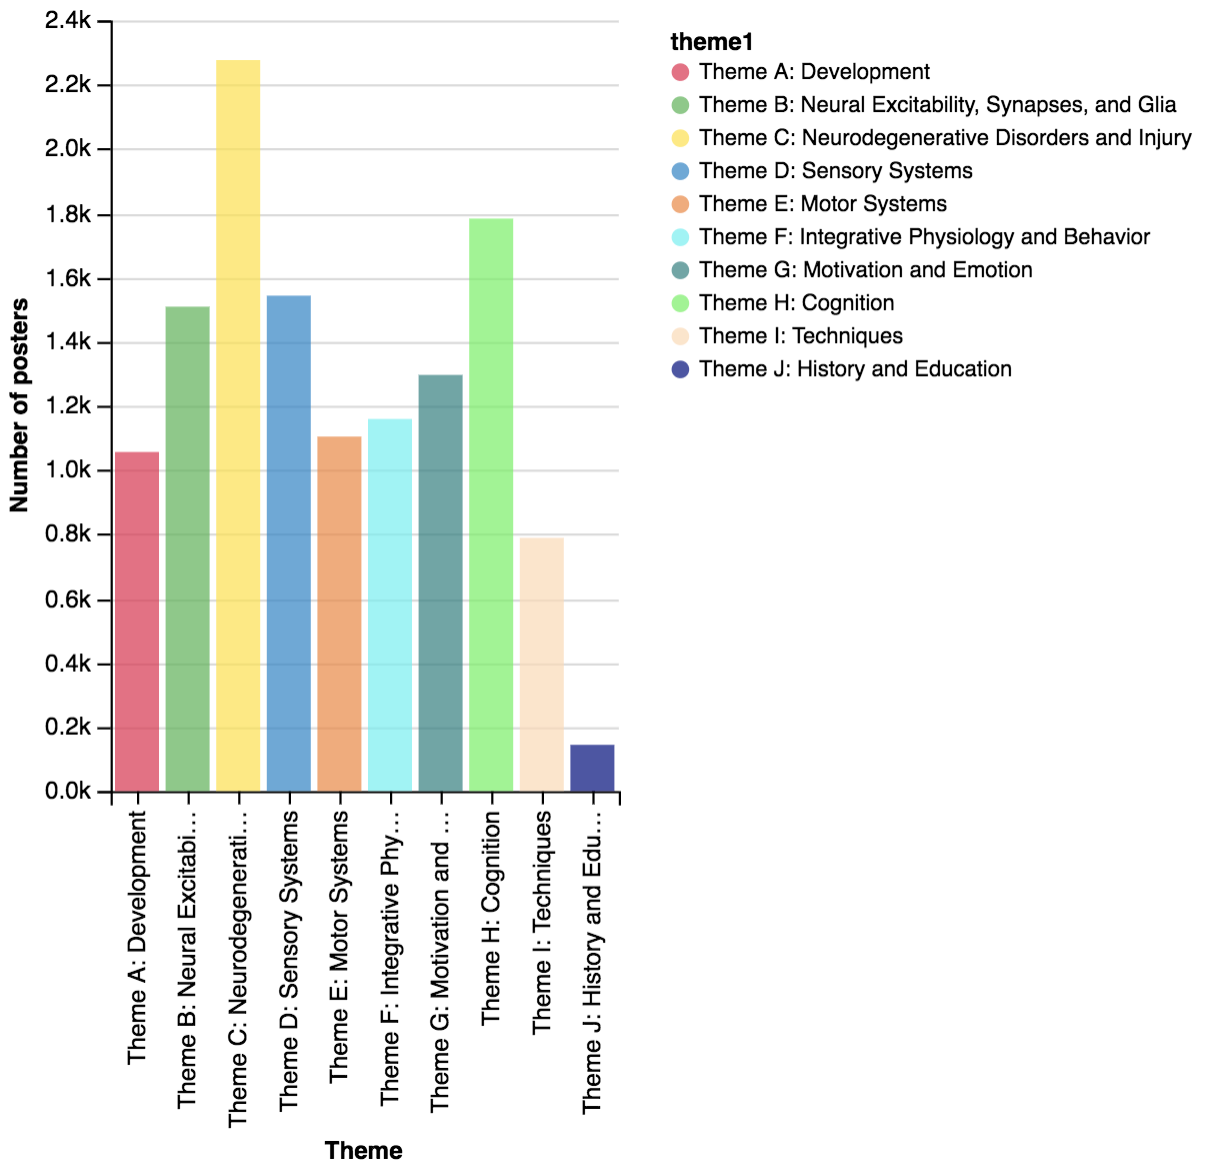
Theme C (Disorders and Injury) has the highest number of posters this year with 2278 posters follows by Theme H (Cognition) with 1780 posters. If we plot by days dividing into morning and afternoon session, the distribution will look like the following


Definitely, if you want to check posters in theme J about history and education (which I’m not quite sure what it is), you have to go on the first day of the conference. The distribution is pretty similar across days and time with small variation. However, if you are interested in theme C, you should attend the second day morning session.
Author disambiguation across all posters
I was a little curious about how many people are actually involved in SfN conference.
I take all the 14,700 posters and see number of total authors in all the papers.
There are 72,181 total authors in all posters submitted in SfN. In the list, there might be duplicate
authors (such as K. Deisseroth, MIT, K. Deisseroth, Massachusetts Institute of Technology).
We can capture data duplication using dedupe library. For author disambiguation,
we can use first initials, last name and affiliation and figure out how many unique
authors appear in all the posters in SfN. I found that there are approximately 53,919 unique authors
in the papers in the conference (recall = 0.905, precision = 0.902). This is 47 percent of total people in Neurotree which is a lot of people!
Language aspect in the conference
There was a recent cool paper published on arXiv by Martin Gerlach from Luis Amaral Lab at Northwestern who proposes a metric to measure similarity between 2 fields using Jensen-Shanon entropy. He also published the source code on Github here (feel free to check it out or check my implementation here). Basically, the proposed metric can capture a difference between long-tail probability distribution of a word distribution between the fields. It works a bit better than cosine distance so we’ll use it in the analysis.
In the paper, they applied to the distribution of words across fields in Scopus data.
I apply the same analysis between group of papers in the same topics in SfN.
Note that there are 83 unique topics such as C.04. Movement Disorders, G.06. Post-traumatic Stress Disorder and F.01. Neuroethology so
you will see 83 by 83 matrix in the plot. Basically, we want to see topics that are similar to each
other by language (i.e. they use similar language on titles and abstracts). Below, I compare between
expert distance using Hamming distance between topics and distance between topics using Jensen-Shanon entropy.
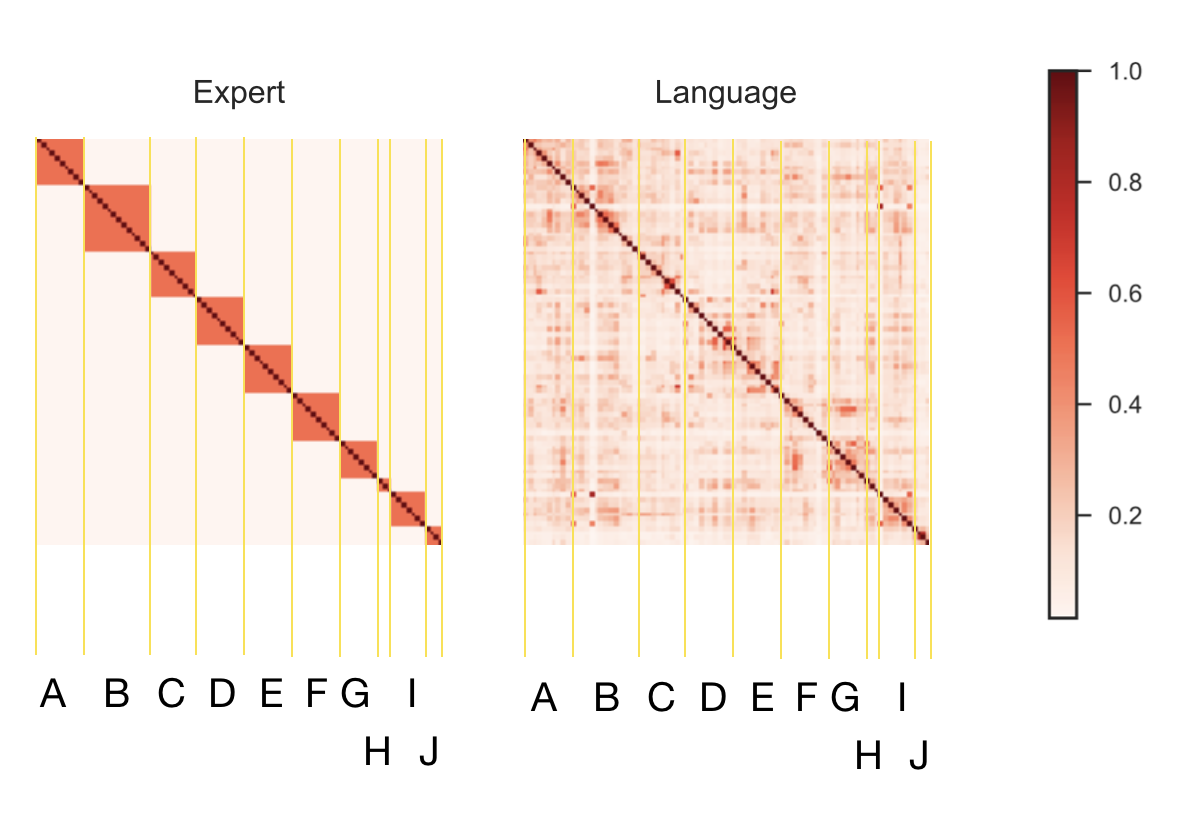
If we compute Pearson correlation between lower diagonal excluding diagonal between 2 matrices, we get correlation coefficient around 0.7 (p < 0.001). This means that the topic proposed by SfN can capture similarity between language people use. There are cross topics that people tend to use similar language. Here, I list top topic pairs in SfN that have similar language usage.
| Topic | Topic | distance |
|---|---|---|
| B.05. Transporters | I.01. Molecular, Biochemical, and Genetic Techniques | 0.164 |
| J.02. Teaching of Neuroscience | J.03. Public Awareness of Neuroscience | 0.215 |
| C.09. Brain Injury and Trauma | E.09. Spinal Cord Injury and Plasticity | 0.290 |
| D.09. Visual Sensory-motor Processing | E.01. Eye Movements | 0.365 |
| D.09. Visual Sensory-motor Processing | D.10. Multisensory Integration | 0.402 |
| A.04. Transplantation and Regeneration | C.09. Brain Injury and Trauma | 0.422 |
| D.07. Vision | D.09. Visual Sensory-motor Processing | 0.427 |
| B.01. Neurotransmitters and Signaling Molecules | I.01. Molecular, Biochemical, and Genetic Techniques | 0.439 |
| D.07. Vision | D.10. Multisensory Integration | 0.440 |
| I.01. Molecular, Biochemical, and Genetic Techniques | I.07. Data Analysis and Statistics | 0.440 |
| G.01. Appetitive and Aversive Learning | G.06. Post-traumatic Stress Disorder | 0.450 |
| F.04. Stress and the Brain | G.06. Post-traumatic Stress Disorder | 0.455 |
| B.01. Neurotransmitters and Signaling Molecules | B.05. Transporters | 0.455 |
| B.07. Synaptic Transmission | B.08. Synaptic Plasticity | 0.465 |
| F.04. Stress and the Brain | G.05. Anxiety Disorders | 0.479 |
| B.09. Physiological Properties of Neurons | B.10. Network Interactions | 0.482 |
| F.04. Stress and the Brain | G.04. Mood Disorders: Depression and Bipolar Disorders | 0.484 |
| C.06. Neurotoxicity, Inflammation, and Neuroprotection | C.09. Brain Injury and Trauma | 0.485 |
| E.04. Voluntary Movements | E.10. Motor Neurons and Muscle | 0.487 |
| E.04. Voluntary Movements | E.05. Brain-Machine Interface | 0.493 |
| A.06. Synaptogenesis and Activity-Dependent Development | B.07. Synaptic Transmission | 0.505 |
As you can see here, these are topics that do not lie into the same theme but community tends to use similar language which we find it here. We can also list fields that are far from everyone else in neuroscience in language perspective.
| Topic |
|---|
| F.09. Thirst and Water Balance |
| C.10. Tauopathies, Tau-dementias, and Prion diseases |
| B.05. Transporters |
| J.02. Teaching of Neuroscience |
| I.01. Molecular, Biochemical, and Genetic Techniques |
| J.04. Ethical and Policy Issues in Neuroscience |
| J.03. Public Awareness of Neuroscience |
| B.14. Neuro-Oncology |
| D.08. Vestibular System |
| D.05. Olfaction and Taste |
Not only that, if we apply hierarchical clustering algorithm on language distance matrix. We can see the clusters of neuroscience topics by language.

It might be interested to see in details how people write abstracts in these given topics and see why it is dissimilar from other topics. This might also be useful for SfN where they can arrange the topics or themes more meaningful in the future (just my thinking).
Prologue
This is just a simple analysis that I did over few hours. Please feel free to comment or suggest if there are more analyses you want to see in SfN 2017. I will try to do follow up analysis and update the blog later!
Acknowledgement
This analysis is done at Konrad Kording lab at UPenn (all the wrong analyses here are on me). Thanks Konrad for a great mentorship. Thanks to extra knowledge from Danielle Bassett’s network neuroscience class. Daniel Acuna and Roozbeh Farhoodi for great suggestions. Thanks Martin Gerlach from Luis Amaral Lab at Northwestern for sharing the code of his work. And finally, Torben for editing my writing.